2ndQuadrant is now part of EDB

Bringing together some of the world's top PostgreSQL experts.

2ndQuadrant | PostgreSQL
Mission Critical Databases
  • Contact us
  • EN
    • FR
    • IT
    • ES
    • DE
    • PT
  • Support & Services
  • Products
  • Downloads
    • Installers
      • Postgres Installer
      • 2UDA – Unified Data Analytics
    • Whitepapers
      • Business Case for PostgreSQL Support
      • Security Best Practices for PostgreSQL
    • Case Studies
      • Performance Tuning
        • BenchPrep
        • tastyworks
      • Distributed Clusters
        • ClickUp
        • European Space Agency (ESA)
        • Telefónica del Sur
        • Animal Logic
      • Database Administration
        • Agilis Systems
      • Professional Training
        • Met Office
        • London & Partners
      • Database Upgrades
        • Alfred Wegener Institute (AWI)
      • Database Migration
        • International Game Technology (IGT)
        • Healthcare Software Solutions (HSS)
        • Navionics
  • Postgres Learning Center
    • Webinars
      • Upcoming Webinars
      • Webinar Library
    • Whitepapers
      • Business Case for PostgreSQL Support
      • Security Best Practices for PostgreSQL
    • Blog
    • Training
      • Course Catalogue
    • Case Studies
      • Performance Tuning
        • BenchPrep
        • tastyworks
      • Distributed Clusters
        • ClickUp
        • European Space Agency (ESA)
        • Telefónica del Sur
        • Animal Logic
      • Database Administration
        • Agilis Systems
      • Professional Training
        • Met Office
        • London & Partners
      • Database Upgrades
        • Alfred Wegener Institute (AWI)
      • Database Migration
        • International Game Technology (IGT)
        • Healthcare Software Solutions (HSS)
        • Navionics
    • Books
      • PostgreSQL 11 Administration Cookbook
      • PostgreSQL 10 Administration Cookbook
      • PostgreSQL High Availability Cookbook – 2nd Edition
      • PostgreSQL 9 Administration Cookbook – 3rd Edition
      • PostgreSQL Server Programming Cookbook – 2nd Edition
      • PostgreSQL 9 Cookbook – Chinese Edition
    • Videos
    • Events
    • PostgreSQL
      • PostgreSQL – History
      • Who uses PostgreSQL?
      • PostgreSQL FAQ
      • PostgreSQL vs MySQL
      • The Business Case for PostgreSQL
      • Security Information
      • Documentation
  • About Us
    • About 2ndQuadrant
    • 2ndQuadrant’s Passion for PostgreSQL
    • News
    • Careers
    • Team Profile
  • Blog
  • Menu Menu
You are here: Home1 / Blog2 / OmniDB3 / OmniDB: Monitoring Dashboard
William Ivanski

OmniDB: Monitoring Dashboard

February 8, 2018/0 Comments/in OmniDB, William's PlanetPostgreSQL /by William Ivanski

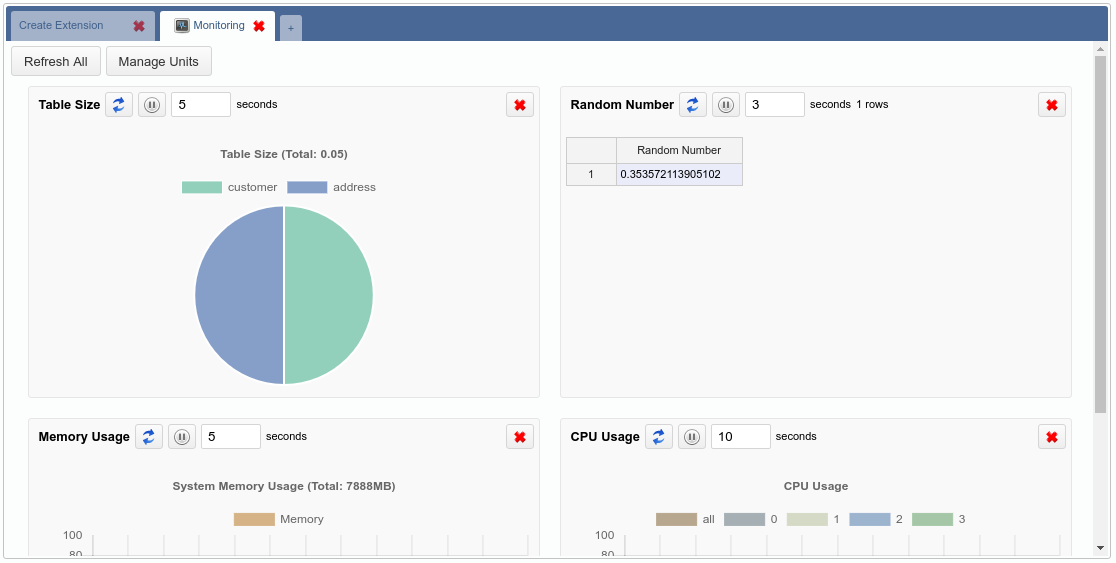
OmniDB 2.4.0 introduces a new cool feature called Monitoring Dashboard. We know a picture is worth a thousand words, so please take a look:

As you can see, this is a new kind of inner tab showing some charts and grids. This Monitoring inner tab is automatically opened once you expand the tree root node (the PostgreSQL node). You can keep it open or close it at any time. To open it again, right-click the root node and click on Dashboard.

The dashboard is composed of handy information rectangles called Monitoring Units. Currently there are 3 types of Monitoring Units:

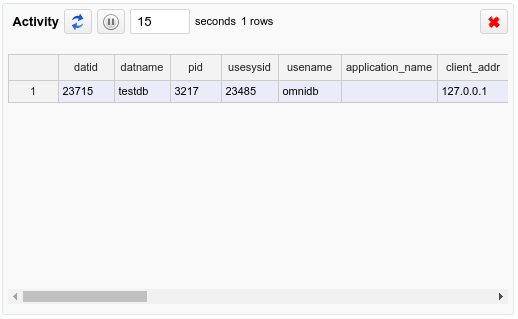
  • Grid: The most simple kind, just executes a query from time to time and shows the results in a data grid.

  • Chart: Every time it refreshes, it renders a new complete chart. The old set of values is lost. This is most useful for pie charts, but other kind of charts can be used too.

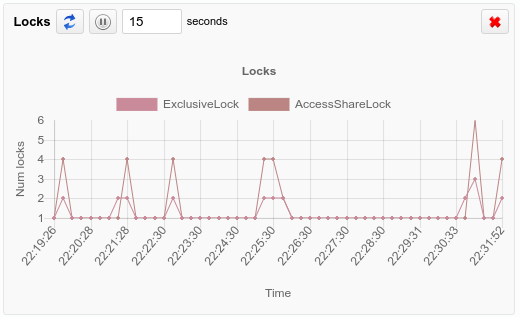
  • Chart-Append: Perhaps this is the most useful kind of Monitoring Unit. It is a chart that appends a new set of values every time it refreshes. Line or bar charts fit best for this type. The last 50 set of values are kept by the component client-side to be viewed by the user.

If you click in the button Refresh All, then all Monitoring Units will be refreshed at once. You can also remove undesired Monitoring Units by clicking in the Remove button. To add units to the Dashboard, click on the Manage Units button, and then click on the green action to add the Monitoring Unit you choose. This way, you can add and remove any unit you want to customize the dashboard the way you want.

Writing custom Monitoring Units

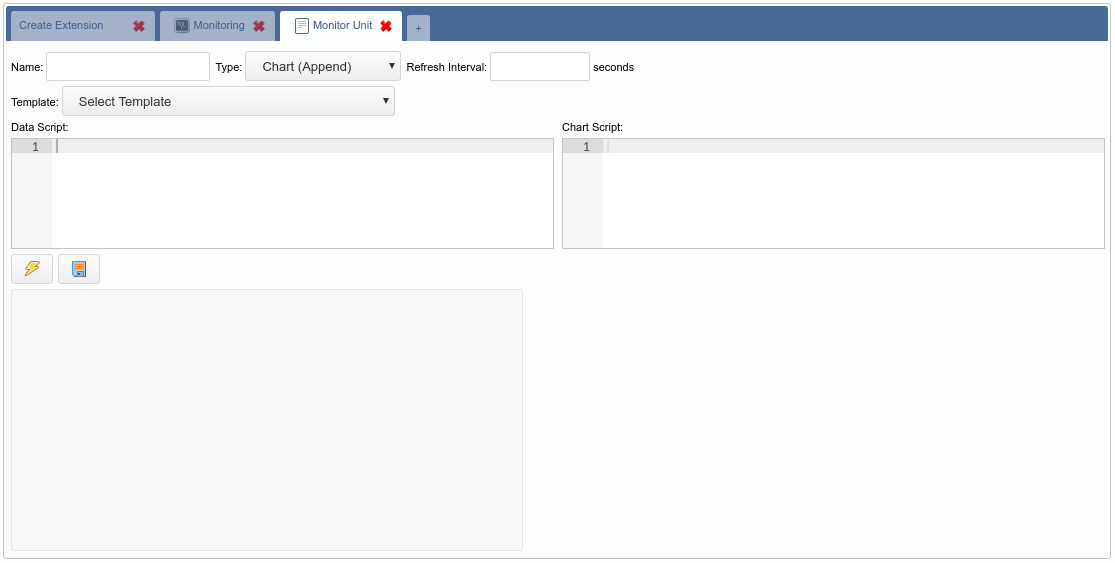
OmniDB provides you the power to write your own units and customize existing ones. Everything is done through Python scripts that run inside a sandbox. To create a new Monitoring Unit, click on the Manage Units button in the dashboard, then click on the New Unit button. It will open a new kind of inner tab like this:

The easiest way to write a custom unit is to use an existing one as template. Go ahead and select the (Chart) Database Size template:

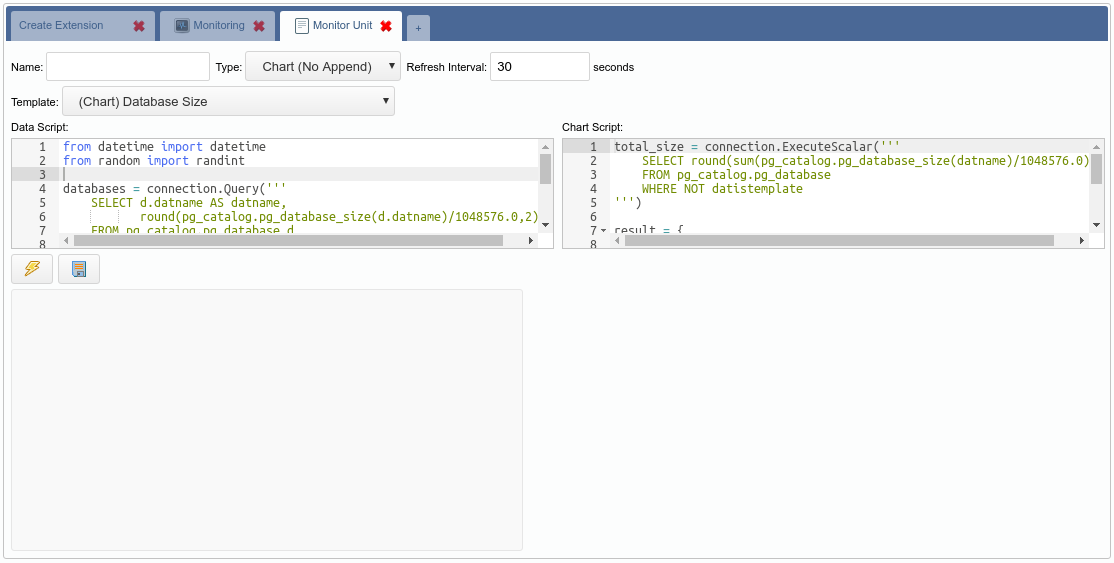
You can find a more detailed explanation about each script in OmniDB documentation. For now, keep in mind that there are two scripts:

  • Data Script: Executed every time the unit is refreshed;
  • Chart Script: Executed only at the beginning to build the chart.

Let us take a look at the Data Script. This template is for a Pie chart. So right now you are probably guessing that you just need to change the SQL query to make the chart behave different. Well, in terms of data and datasets, you guessed right. So let’s change the SQL query of this chart to compare sizes of tables of schema public. Also change the references from datname to tablename, as we have changed the column name.

from datetime import datetime
from random import randint

databases = connection.Query('''
 SELECT c.relname as tablename,
 round(pg_catalog.pg_total_relation_size(c.oid)/1048576.0,2) AS size
 FROM pg_catalog.pg_class c
 INNER JOIN pg_catalog.pg_namespace n
 ON n.oid = c.relnamespace
 WHERE n.nspname = 'public'
 AND c.relkind = 'r'
''')

data = []
color = []
label = []

for db in databases.Rows:
 data.append(db["size"])
 color.append("rgb(" + str(randint(125, 225)) + "," + str(randint(125, 225)) + "," + str(randint(125, 225)) + ")")
 label.append(db["tablename"])

result = {
 "labels": label,
 "datasets": [
 {
 "data": data,
 "backgroundColor": color,
 "label": "Dataset 1"
 }
 ]
}

Copy and paste the above script into the Data Script field and then hit the Test button:

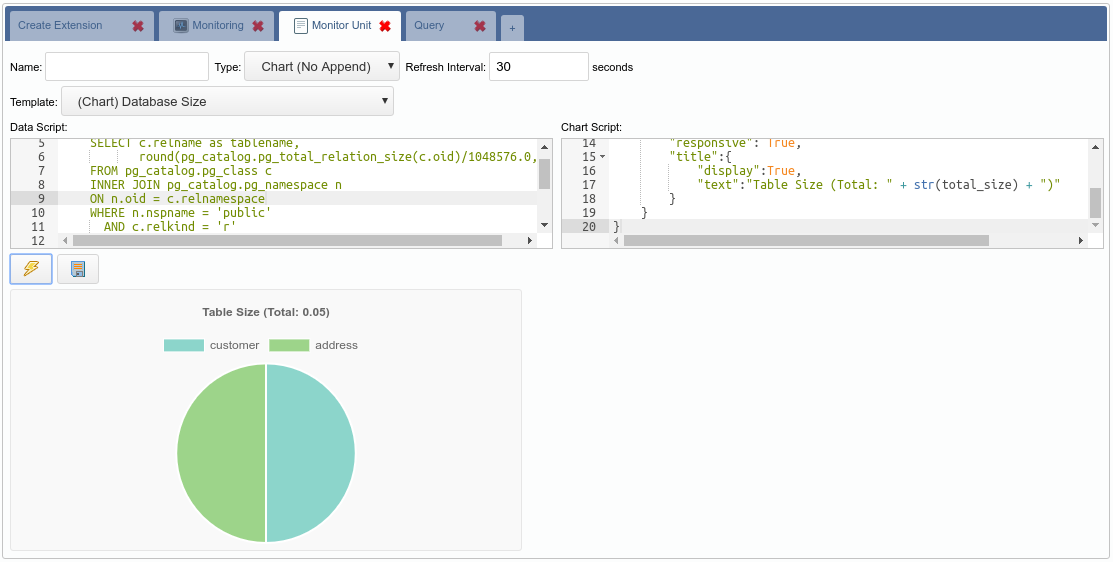
Apparently the chart is almost done. We need to fix the title, it still says Database Size, when this chart is about table size. Any information about the format of the chart itself is defined in the Chart Script text field. So we just need to change the query and adjust the title, this way:

total_size = connection.ExecuteScalar('''
 SELECT round(sum(pg_catalog.pg_total_relation_size(c.oid)/1048576.0),2) AS size
 FROM pg_catalog.pg_class c
 INNER JOIN pg_catalog.pg_namespace n
 ON n.oid = c.relnamespace
 WHERE n.nspname = 'public'
 AND c.relkind = 'r'
''')

result = {
 "type": "pie",
 "data": None,
 "options": {
 "responsive": True,
 "title":{
 "display":True,
 "text":"Table Size (Total: " + str(total_size) + ")"
 }
 }
}

Copy and paste the above Python code into the Chart Script. Then click in the Test button:

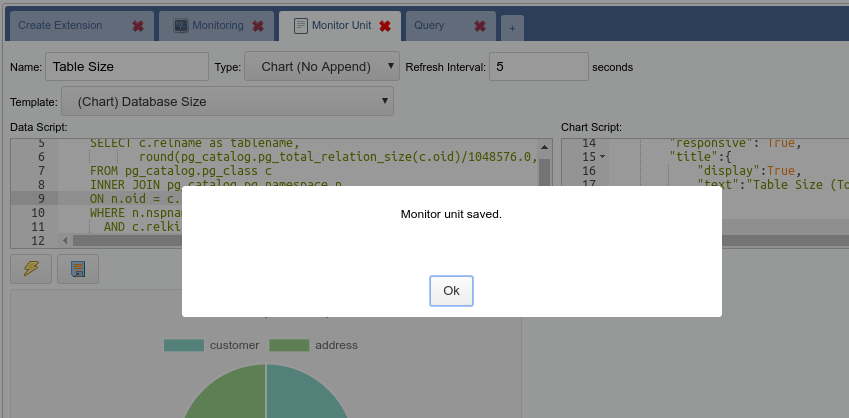
Now that the chart finally works the way we want, we can give it a title, adjust the refresh interval and then click in the Save button. After that we can add it to the dashboard.

All Monitoring Units that come with OmniDB are open source and available in this repository (feel free to contribute).

Stay tuned for the next big monitoring feature: Persistent Monitoring!

Tags: OmniDB
Share this entry
  • Share on Facebook
  • Share on Twitter
  • Share on WhatsApp
  • Share on LinkedIn
0 replies

Leave a Reply

Want to join the discussion?
Feel free to contribute!

Leave a Reply Cancel reply

Your email address will not be published. Required fields are marked *

Search

Get in touch with us!

Recent Posts

  • Random Data December 3, 2020
  • Webinar: COMMIT Without Fear – The Beauty of CAMO [Follow Up] November 13, 2020
  • Full-text search since PostgreSQL 8.3 November 5, 2020
  • Random numbers November 3, 2020
  • Webinar: Best Practices for Bulk Data Loading in PostgreSQL [Follow Up] November 2, 2020

Featured External Blogs

Tomas Vondra's Blog

Our Bloggers

  • Simon Riggs
  • Alvaro Herrera
  • Andrew Dunstan
  • Craig Ringer
  • Francesco Canovai
  • Gabriele Bartolini
  • Giulio Calacoci
  • Ian Barwick
  • Marco Nenciarini
  • Mark Wong
  • Pavan Deolasee
  • Petr Jelinek
  • Shaun Thomas
  • Tomas Vondra
  • Umair Shahid

PostgreSQL Cloud

2QLovesPG 2UDA 9.6 backup Barman BDR Business Continuity community conference database DBA development devops disaster recovery greenplum Hot Standby JSON JSONB logical replication monitoring OmniDB open source Orange performance PG12 pgbarman pglogical PG Phriday postgres Postgres-BDR postgres-xl PostgreSQL PostgreSQL 9.6 PostgreSQL10 PostgreSQL11 PostgreSQL 11 PostgreSQL 11 New Features postgresql repmgr Recovery replication security sql wal webinar webinars

Support & Services

24/7 Production Support

Developer Support

Remote DBA for PostgreSQL

PostgreSQL Database Monitoring

PostgreSQL Health Check

PostgreSQL Performance Tuning

Database Security Audit

Upgrade PostgreSQL

PostgreSQL Migration Assessment

Migrate from Oracle to PostgreSQL

Products

HA Postgres Clusters

Postgres-BDR®

2ndQPostgres

pglogical

repmgr

Barman

Postgres Cloud Manager

SQL Firewall

Postgres-XL

OmniDB

Postgres Installer

2UDA

Postgres Learning Center

Introducing Postgres

Blog

Webinars

Books

Videos

Training

Case Studies

Events

About Us

About 2ndQuadrant

What does 2ndQuadrant Mean?

News

Careers 

Team Profile

© 2ndQuadrant Ltd. All rights reserved. | Privacy Policy
  • Twitter
  • LinkedIn
  • Facebook
  • Youtube
  • Mail
PostgreSQL Developer Meeting Brussels Oracle with OmniDB
Scroll to top
×