2ndQuadrant is now part of EDB

Bringing together some of the world's top PostgreSQL experts.

2ndQuadrant | PostgreSQL
Mission Critical Databases
  • Contact us
  • EN
    • FR
    • IT
    • ES
    • DE
    • PT
  • Support & Services
  • Products
  • Downloads
    • Installers
      • Postgres Installer
      • 2UDA – Unified Data Analytics
    • Whitepapers
      • Business Case for PostgreSQL Support
      • Security Best Practices for PostgreSQL
    • Case Studies
      • Performance Tuning
        • BenchPrep
        • tastyworks
      • Distributed Clusters
        • ClickUp
        • European Space Agency (ESA)
        • Telefónica del Sur
        • Animal Logic
      • Database Administration
        • Agilis Systems
      • Professional Training
        • Met Office
        • London & Partners
      • Database Upgrades
        • Alfred Wegener Institute (AWI)
      • Database Migration
        • International Game Technology (IGT)
        • Healthcare Software Solutions (HSS)
        • Navionics
  • Postgres Learning Center
    • Webinars
      • Upcoming Webinars
      • Webinar Library
    • Whitepapers
      • Business Case for PostgreSQL Support
      • Security Best Practices for PostgreSQL
    • Blog
    • Training
      • Course Catalogue
    • Case Studies
      • Performance Tuning
        • BenchPrep
        • tastyworks
      • Distributed Clusters
        • ClickUp
        • European Space Agency (ESA)
        • Telefónica del Sur
        • Animal Logic
      • Database Administration
        • Agilis Systems
      • Professional Training
        • Met Office
        • London & Partners
      • Database Upgrades
        • Alfred Wegener Institute (AWI)
      • Database Migration
        • International Game Technology (IGT)
        • Healthcare Software Solutions (HSS)
        • Navionics
    • Books
      • PostgreSQL 11 Administration Cookbook
      • PostgreSQL 10 Administration Cookbook
      • PostgreSQL High Availability Cookbook – 2nd Edition
      • PostgreSQL 9 Administration Cookbook – 3rd Edition
      • PostgreSQL Server Programming Cookbook – 2nd Edition
      • PostgreSQL 9 Cookbook – Chinese Edition
    • Videos
    • Events
    • PostgreSQL
      • PostgreSQL – History
      • Who uses PostgreSQL?
      • PostgreSQL FAQ
      • PostgreSQL vs MySQL
      • The Business Case for PostgreSQL
      • Security Information
      • Documentation
  • About Us
    • About 2ndQuadrant
    • 2ndQuadrant’s Passion for PostgreSQL
    • News
    • Careers
    • Team Profile
  • Blog
  • Menu Menu
You are here: Home1 / Blog2 / Data Mining3 / 2UDA – New features in Orange (Part 2)
Lan Zagar

2UDA – New features in Orange (Part 2)

January 12, 2016/0 Comments/in Data Mining /by Lan Zagar

Orange is continuously being improved and made more friendly and useful for the users based on their feedback and experiences. Some new features were already described in Part 1 of this blog series. Two other new features that appeared recently (available in the latest 2UDA package) are the Color widget and the reporting functionality.

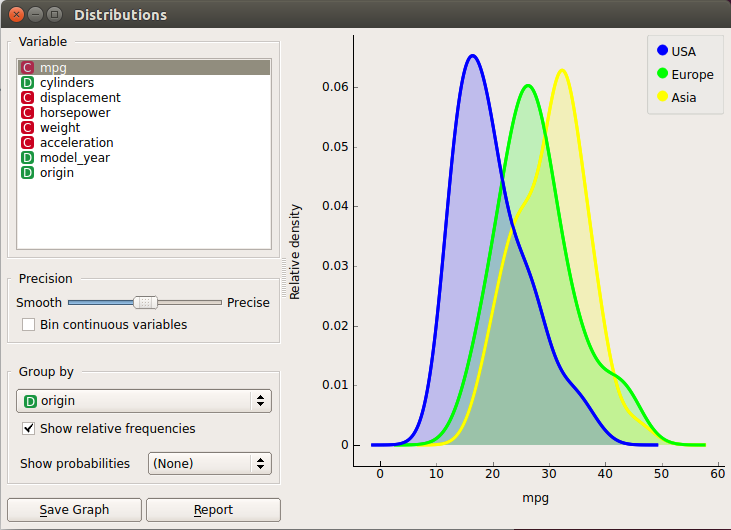
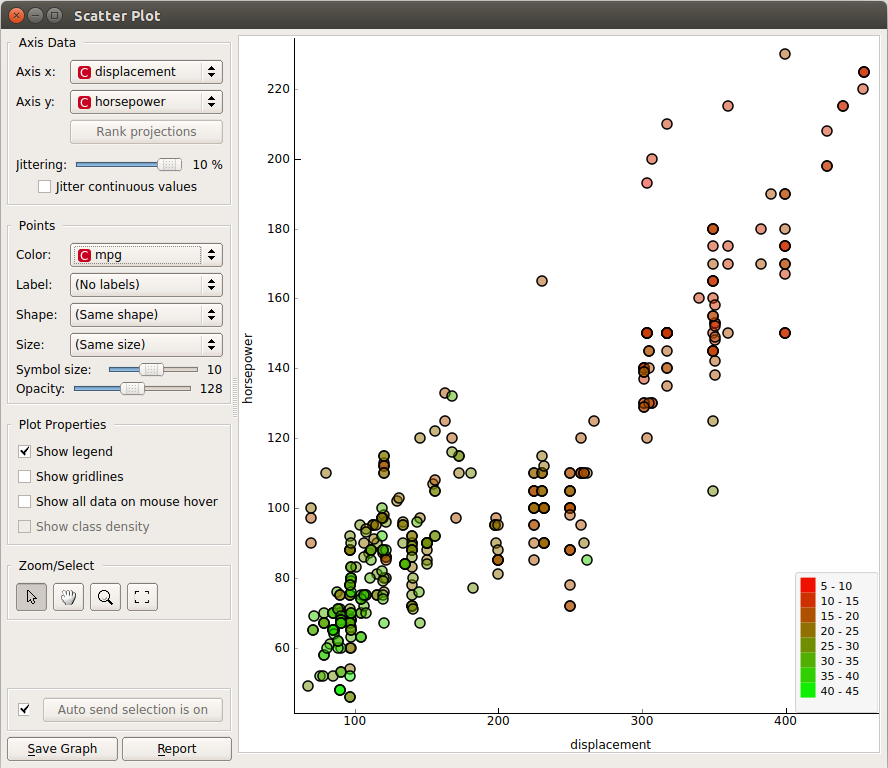
The Color widget introduces a handy new way to assign colors to variable values, appending this information to the data so that it is used in all subsequent visualizations. In older versions the user had the option to set the color palette in individual visualization widgets, which meant that the process had to be repeated in each widget. To try out the new feature with 2UDA, start Orange, and use the Sql Table widget to open the sample_cars table from the included postgresql database (host=localhost, database=sample, user=postgres). We can observe that the origin variable has 3 different values with very non-informative names (1, 2, and 3). Inspecting the rows in Data Table, we can see that origin values could probably be interpreted as: 1=USA, 2=Europe, 3=Asia. The Color widget allows us to assign colors that users expect and associate with these values. While this is of course subjective and can be culturally dependent, it can significantly improve the ease of processing visualizations for a target audience.

Color widget can be used to set better matched colors to variable values.

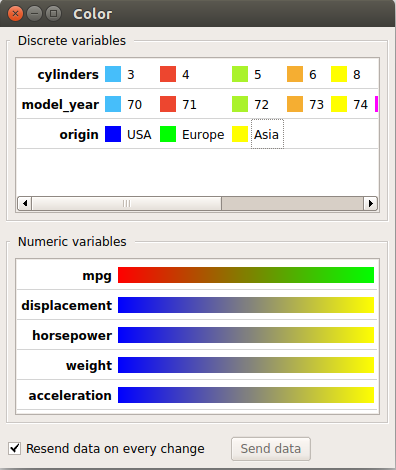
We chose the following value-color pairs: USA=blue, Europe=green, Asia=yellow. Another functionality of the Color widget is that the values (and variables) can also be renamed, so we also changed the numeric IDs with more understandable descriptions. The color spectrum for the mpg variable (miles-per-gallon) was also changed to reflect the economy of a car’s fuel consumption (efficient=green, inefficient=red). Now, when we use e.g. the Distributions or Scatter Plot widgets, they automatically use the new settings.

Distributions of miles-per-gallon values for cars from different regions.

Scatter plot visualization of cars based on their displacement and horsepower, colored by mpg.

Reporting is a very useful new feature which adds a report button to most widgets and allows the user to very easily compile a document describing the actions performed, settings used and also includes the produced visualizations. It makes it much easier to share the results with your colleagues as the reports can be saved as html files and viewed in any browser. The best way to see how it works is to try making a report yourself. A simple example of a report containing visualizations of the sample_cars data set used above (and included in a 2UDA installation) is available here.

Tags: 2UDA, Orange
Share this entry
  • Share on Facebook
  • Share on Twitter
  • Share on WhatsApp
  • Share on LinkedIn
0 replies

Leave a Reply

Want to join the discussion?
Feel free to contribute!

Leave a Reply Cancel reply

Your email address will not be published. Required fields are marked *

Search

Get in touch with us!

Recent Posts

  • Random Data December 3, 2020
  • Webinar: COMMIT Without Fear – The Beauty of CAMO [Follow Up] November 13, 2020
  • Full-text search since PostgreSQL 8.3 November 5, 2020
  • Random numbers November 3, 2020
  • Webinar: Best Practices for Bulk Data Loading in PostgreSQL [Follow Up] November 2, 2020

Featured External Blogs

Tomas Vondra's Blog

Our Bloggers

  • Simon Riggs
  • Alvaro Herrera
  • Andrew Dunstan
  • Craig Ringer
  • Francesco Canovai
  • Gabriele Bartolini
  • Giulio Calacoci
  • Ian Barwick
  • Marco Nenciarini
  • Mark Wong
  • Pavan Deolasee
  • Petr Jelinek
  • Shaun Thomas
  • Tomas Vondra
  • Umair Shahid

PostgreSQL Cloud

2QLovesPG 2UDA 9.6 backup Barman BDR Business Continuity community conference database DBA development devops disaster recovery greenplum Hot Standby JSON JSONB logical replication monitoring OmniDB open source Orange performance PG12 pgbarman pglogical PG Phriday postgres Postgres-BDR postgres-xl PostgreSQL PostgreSQL 9.6 PostgreSQL10 PostgreSQL11 PostgreSQL 11 PostgreSQL 11 New Features postgresql repmgr Recovery replication security sql wal webinar webinars

Support & Services

24/7 Production Support

Developer Support

Remote DBA for PostgreSQL

PostgreSQL Database Monitoring

PostgreSQL Health Check

PostgreSQL Performance Tuning

Database Security Audit

Upgrade PostgreSQL

PostgreSQL Migration Assessment

Migrate from Oracle to PostgreSQL

Products

HA Postgres Clusters

Postgres-BDR®

2ndQPostgres

pglogical

repmgr

Barman

Postgres Cloud Manager

SQL Firewall

Postgres-XL

OmniDB

Postgres Installer

2UDA

Postgres Learning Center

Introducing Postgres

Blog

Webinars

Books

Videos

Training

Case Studies

Events

About Us

About 2ndQuadrant

What does 2ndQuadrant Mean?

News

Careers 

Team Profile

© 2ndQuadrant Ltd. All rights reserved. | Privacy Policy
  • Twitter
  • LinkedIn
  • Facebook
  • Youtube
  • Mail
On pglogical performance The process that created pglogical
Scroll to top
×