On pglogical performance
A few days ago we released pglogical, a fully open-source logical replication solution for PostgreSQL, that’ll hopefully get included into the PostgreSQL tree in a not-too-distant future. I’m not going to discuss about all the things enabled by logical replication – the pglogical release announcement presents a quite good overview, and Simon also briefly explained the advantages of logical replication in another post a few days ago.
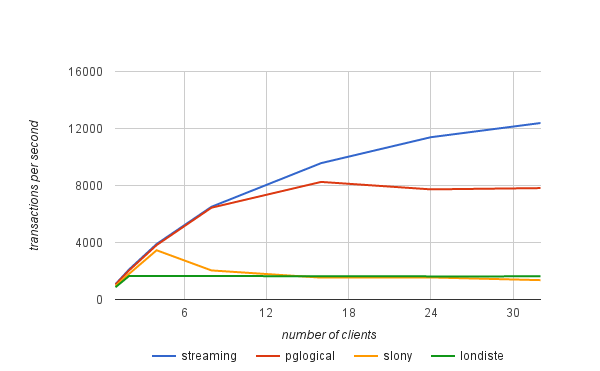
Instead I’d like to talk about one particular aspect mentioned in the announcement – performance comparison with existing solutions. The pglogical page mentions
… preliminary internal testing demonstrating a 5x increase in transaction throughput (OLTP workloads using pgBench ) over other replication methods like slony and londiste3. So let’s see where the statement comes from.
Benchmark
This post explains the details for the benchmarks we performed to find the maximum “sustainable” throughput (transactions per second) each of the solutions can handle without lagging. To do that I’ve ran a number of pgbench tests on a pair of i2.4xlarge AWS instances with varying number of clients, and measuring the throughput on the master and how long it took the standby to catch up (if it was lagging). The results were then used to compute an estimate of the maximum throughput on the standby node.
For example let’s say we’ve been running pgbench with 16 clients for 30 minutes, and we’ve measured 10000 tps on the master, but the standby was lagging and took another 15 minutes to catch up. Then the maximum sustainable throughput estimate is
tps = (transactions executed) / (total runtime until standby caught up)
i.e.
tps = (30 60 10.000) / (45 * 60) = 18.000.000 / 2.700 = 6.666
So in that case the maximum sustainable throughput on the standby is 6.666 tps, i.e. only ~66% of the transaction rate measured on the master.
System
The benchmark was performed on a pair of i2.4xlarge AWS instances, configured in the same placement group (so with ~2Gbit network connection between them), and 4x SSD drives configured in RAID-0 (so I/O is unlikely to be a problem here). The instances have ~122GB of RAM, so the data set (pgbench with scale 5000) fits into RAM. All the tests were performed on PostgreSQL 9.5.0 with exactly the same configuration:
checkpoint_timeout = 15min

effective_io_concurrency = 32

maintenance_work_mem = 1GB

max_wal_size = 8GB

min_wal_size = 2GB

shared_buffers = 16GB
For all replication systems, the most recent available version was used, particularly
and a simple replication was set up as described in the tutorials (both use the pgbench example used for the benchmark).
Results
The results presented next also include streaming replication (asynchronous mode) to give you a better idea of the overhead associated with logical replication. The transaction rates are not the "raw" numbers as measured by pgbench, but the "sustainable" rates computed using the formula presented at the beginning of this post.
| clients | streaming | pglogical | slony | londiste |
|---|---|---|---|---|
| 1 | 1075 | 1052 | 949 | 861 |
| 2 | 2118 | 2048 | 1806 | 1657 |
| 4 | 3894 | 3820 | 3456 | 1643 |
| 8 | 6506 | 6442 | 2040 | 1645 |
| 16 | 9570 | 8251 | 1535 | 1635 |
| 24 | 11388 | 7728 | 1548 | 1622 |
| 32 | 12384 | 7818 | 1358 | 1623 |


Hi tomas,
Can pglogical do the multi master to single slave replication.