2ndQuadrant is now part of EDB

Bringing together some of the world's top PostgreSQL experts.

2ndQuadrant | PostgreSQL
Mission Critical Databases
  • Contact us
  • EN
    • FR
    • IT
    • ES
    • DE
    • PT
  • Support & Services
    • Support
      • 24/7 PostgreSQL Support
      • Developer Support
    • DBA Services
      • Remote DBA
      • Database Monitoring
    • Consulting Services
      • Health Check
      • Performance Tuning
      • Database Security Audit
      • PostgreSQL Upgrade
    • Migration Services
      • Migrate to PostgreSQL
      • Migration Assessment
  • Products
    • Postgres-BDR ®
    • PostgreSQL High Availability
    • Kubernetes Operators for BDR & PostgreSQL
    • Managed PostgreSQL in the Cloud
    • Installers
      • Postgres Installer
      • 2UDA
    • 2ndQPostgres
    • pglogical
    • Barman
    • repmgr
    • OmniDB
    • SQL Firewall
    • Postgres-XL
  • Downloads
    • Installers
      • Postgres Installer
      • 2UDA – Unified Data Analytics
    • Whitepapers
      • Business Case for PostgreSQL Support
      • Security Best Practices for PostgreSQL
    • Case Studies
      • Performance Tuning
        • BenchPrep
        • tastyworks
      • Distributed Clusters
        • ClickUp
        • European Space Agency (ESA)
        • Telefónica del Sur
        • Animal Logic
      • Database Administration
        • Agilis Systems
      • Professional Training
        • Met Office
        • London & Partners
      • Database Upgrades
        • Alfred Wegener Institute (AWI)
      • Database Migration
        • International Game Technology (IGT)
        • Healthcare Software Solutions (HSS)
        • Navionics
  • Postgres Learning Center
    • Webinars
      • Upcoming Webinars
      • Webinar Library
    • Whitepapers
      • Business Case for PostgreSQL Support
      • Security Best Practices for PostgreSQL
    • Blog
    • Training
      • Course Catalogue
    • Case Studies
      • Performance Tuning
        • BenchPrep
        • tastyworks
      • Distributed Clusters
        • ClickUp
        • European Space Agency (ESA)
        • Telefónica del Sur
        • Animal Logic
      • Database Administration
        • Agilis Systems
      • Professional Training
        • Met Office
        • London & Partners
      • Database Upgrades
        • Alfred Wegener Institute (AWI)
      • Database Migration
        • International Game Technology (IGT)
        • Healthcare Software Solutions (HSS)
        • Navionics
    • Books
      • PostgreSQL 11 Administration Cookbook
      • PostgreSQL 10 Administration Cookbook
      • PostgreSQL High Availability Cookbook – 2nd Edition
      • PostgreSQL 9 Administration Cookbook – 3rd Edition
      • PostgreSQL Server Programming Cookbook – 2nd Edition
      • PostgreSQL 9 Cookbook – Chinese Edition
    • Videos
    • Events
    • PostgreSQL
      • PostgreSQL – History
      • Who uses PostgreSQL?
      • PostgreSQL FAQ
      • PostgreSQL vs MySQL
      • The Business Case for PostgreSQL
      • Security Information
      • Documentation
  • About Us
    • About 2ndQuadrant
    • 2ndQuadrant’s Passion for PostgreSQL
    • News
    • Careers
    • Team Profile
  • Blog
  • Menu Menu
You are here: Home1 / Blog2 / OmniDB3 / OmniDB – Now with PL/pgSQL debugger!
Rafael Castro

OmniDB – Now with PL/pgSQL debugger!

October 31, 2017/0 Comments/in OmniDB, Rafael's PlanetPostgreSQL /by Rafael Castro

OmniDB’s 2.3.0 release, which is coming out on November 2nd, comes with a much requested feature: a debugger for PL/pgSQL functions. This post will walk you through the steps to start debugging your functions inside OmniDB.

1. Requirements

The debugger takes advantage of hooks, an extensibility in PostgreSQL’s source code that allows us to perform custom actions when specific actions are performed in the database. For the debugger we use hooks that are triggered when PL/pgSQL functions are called, and each statement is executed.

This requires the user to install a binary library and enable it in PostgreSQL’s config file.

The debugger also uses a special schema with special tables to control the whole debugging process. This can be manually created or with an extension.

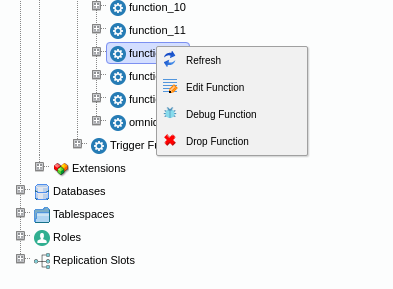
2. Debugging Interface

The debugging process is very straightforward, if OmniDB detects that the current database contains the ‘omnidb’ schema, it will enable the action ‘Debug Function’ in the function context menu:

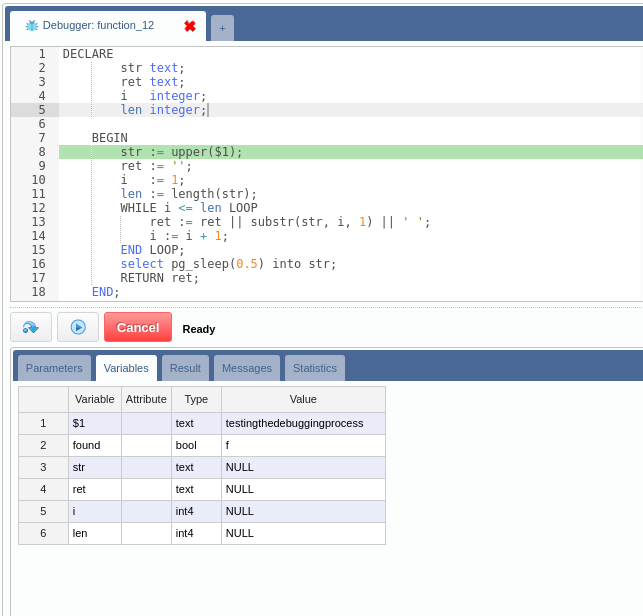
The debugging interface is composed of an SQL editor that will show the process step by step on top of the function source code, and 5 tabs to manage and view different parts of the debugger.

2.1. Parameters

Before the debugging process starts, the user must provide all the parameters in this tab.

The parameters must be provided exactly the same way you would provide them if you were executing the function yourself, quoting strings for instance.

2.2. Variables

This grid displays the current value of each variable that exists in the current execution context, it will be updated with every step.

2.3. Result

When the function ends, this tab will show the result of the function call. It could be empty or even just a set of rows.

2.4. Messages

Messages returned explicitly by RAISE commands or even automatic messages from PostgreSQL will be presented in this tab.

2.5. Statistics

At the end of the debugging process, a chart depicting execution times for each line in the function body will be presented in this tab. Additionally, the SQL editor will be updated with a set of colors representing a heat map, from blue to red, according to the max duration of each line.

2.6. Breakpoint

The interface enables the user to add one breakpoint to any line. This breakpoint is created by clicking in the row header (the line number) in the SQL editor. The breakpoint can be changed at any time when there isn’t a step in progress.

2.7. Actions

The current version of the debbuger allows the user to step over to next statement and resume execution, which will stop in the next breakpoint or continue until the end of the function.

3. Debugging Example

Let’s debug a simple function that receives a string and returns another string, adding a white space between each character from the original.

Adjust the parameter and click in the start button.

We are at the beginning of the debugging process, the current line number is 8 and the variables didn’t receive any value yet. The debugger can be stopped at any time by clicking in the Cancel button.

Let’s add a breakpoint in line 16 and resume execution, OmniDB’s interface will regain control over the debugging operation as soon as all statements before the breakpoint are completed.

Let’s resume again, the process will reach the end of the function and display results.

As can be seen in the chart and in the editor, the line 16 took most of the time.

4. Performance

The debugging process in PostgreSQL is only executed if a special flag is activated by OmniDB. Other function calls will execute normally after checking that the flag is false. Tests show that this check does not affect performance.

5. Roadmap

Future releases will include additional features in the debugging process:

  • Step Into
  • Multiple breakpoints
  • Call stack
  • Call graph

Stay tuned for more!

Share this entry
  • Share on Facebook
  • Share on Twitter
  • Share on WhatsApp
  • Share on LinkedIn
0 replies

Leave a Reply

Want to join the discussion?
Feel free to contribute!

Leave a Reply Cancel reply

Your email address will not be published. Required fields are marked *

Search

Get in touch with us!

Recent Posts

  • Random Data December 3, 2020
  • Webinar: COMMIT Without Fear – The Beauty of CAMO [Follow Up] November 13, 2020
  • Full-text search since PostgreSQL 8.3 November 5, 2020
  • Random numbers November 3, 2020
  • Webinar: Best Practices for Bulk Data Loading in PostgreSQL [Follow Up] November 2, 2020

Featured External Blogs

Tomas Vondra's Blog

Our Bloggers

  • Simon Riggs
  • Alvaro Herrera
  • Andrew Dunstan
  • Craig Ringer
  • Francesco Canovai
  • Gabriele Bartolini
  • Giulio Calacoci
  • Ian Barwick
  • Marco Nenciarini
  • Mark Wong
  • Pavan Deolasee
  • Petr Jelinek
  • Shaun Thomas
  • Tomas Vondra
  • Umair Shahid

PostgreSQL Cloud

2QLovesPG 2UDA 9.6 backup Barman BDR Business Continuity community conference database DBA development devops disaster recovery greenplum Hot Standby JSON JSONB logical replication monitoring OmniDB open source Orange performance PG12 pgbarman pglogical PG Phriday postgres Postgres-BDR postgres-xl PostgreSQL PostgreSQL 9.6 PostgreSQL10 PostgreSQL11 PostgreSQL 11 PostgreSQL 11 New Features postgresql repmgr Recovery replication security sql wal webinar webinars

Support & Services

24/7 Production Support

Developer Support

Remote DBA for PostgreSQL

PostgreSQL Database Monitoring

PostgreSQL Health Check

PostgreSQL Performance Tuning

Database Security Audit

Upgrade PostgreSQL

PostgreSQL Migration Assessment

Migrate from Oracle to PostgreSQL

Products

HA Postgres Clusters

Postgres-BDR®

2ndQPostgres

pglogical

repmgr

Barman

Postgres Cloud Manager

SQL Firewall

Postgres-XL

OmniDB

Postgres Installer

2UDA

Postgres Learning Center

Introducing Postgres

Blog

Webinars

Books

Videos

Training

Case Studies

Events

About Us

About 2ndQuadrant

What does 2ndQuadrant Mean?

News

Careers 

Team Profile

© 2ndQuadrant Ltd. All rights reserved. | Privacy Policy
  • Twitter
  • LinkedIn
  • Facebook
  • Youtube
  • Mail
Oracle High Availability concepts in PostgreSQL How long does it take to change your mind?
Scroll to top
×